From pen and paper...
As part of a team of three UX designers, we were entrusted with the task of conducting a feasibility study to digitize the workflow at YrkesAkademin. The primary objective was to optimize their operations for teachers in their education of bus and truck drivers. Previously, they relied on a multitude of IT systems, Excel documents, and traditional pen-and-paper methods in their daily routines.
To start our project, we gathered data from Yrkesakademin's own documentation and conducting interviews with staff members in various positions. This allowed us to gain valuable insights and perspectives. We analyzed the data, identified different user roles, and crafted a flowchart encompassing the entire system. The study's results were presented through both a comprehensive report and a presentation. The report included an analysis of the system's users and authorization, a detailed flowchart outlining the intended system, and a list of functional requirements. Additionally, it provided a time and financial plan divided into an MVP (Minimum Viable Product), Phase 1, and Phase 2. Furthermore, the report included a roadmap for the project's future progression.
By undertaking this project, we aimed to provide YrkesAkademin with a comprehensive blueprint for their digital transformation journey. Our report not only highlighted the challenges they faced but also presented actionable solutions. In addition, we conducted a cost estimation, offering them valuable insights into the financial implications associated with the development and deployment of the recommended product.
Overall, our involvement in this project demonstrated our ability to understand complex workflows, identify pain points, and design effective digital solutions. Through collaboration and thorough analysis, we equipped YrkesAkademin with the necessary knowledge and guidance to continue on their digital journey.
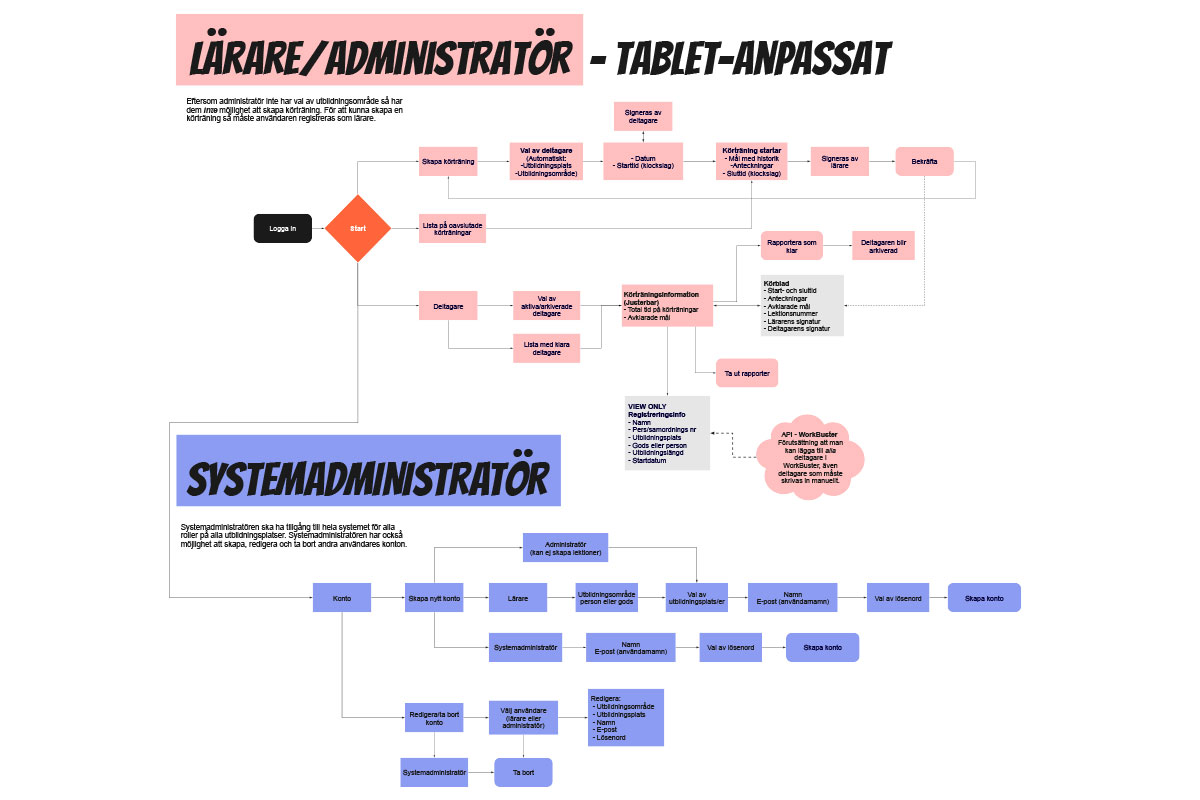
Take a closer look at the whole flow chart